We Have a Bottom Line
Please
                                 For a Solution Visit Educating the Class of 2034


Needs Assessment

26% Strong Academics for College

10% Academics for Associates
or Technical Education

66% Basic and Life Skills Education

70% Enrolled in College Creates Oversupply Problems

Result is Deep Doo Doo for 40 plus percent

Read These Uncomfortable  Statistics


Our Most Educated Generation Has No Savings and Many Have Large Debts

(Source: Urban Institute)

 Chart Urban Institute

Many Have Poor Job Prospects as Only Our
Best and Brightest Find Good Jobs

image


online.wsj  2/15/13             Please     


Others Have the Problem

All Because

Education is directed toward college and not employment.

 Increase in the Supply of College Graduates
Does Not Create Demand for College Graduates.

Goal of Academics and Publishers is to Make Money.

The Bottom Line

Bright Students Are Serviced but Face Severe Competition.

Most Students Are Not Well Prepared for Work/Life

For a Solution Visit Educating the Class of 2034

Please                                                          

Please  E-mail or antonw@ix.netcom.com
the retired teacher/editor/author Walter


Staying Current

1) John William Pope Center for Higher Education Policy  covers post-secondary issues.

2) The Rising Value of a Science Degree

College Degree Value:
 
3) P-Tech Early College High Schools are vocationally oriented.
4) Why Motivation Beats Raw Intelligence 
'Almost Every Time'

5) Race Against the Machines that total good jobs requiring an education are losing out to machines. Editor's Note:  This is good news as machines don't eat standard of living will rise dramatically and this means education has new, important issues to deal with that requiring well educated human development specialists.
6) Oversupply of Teachers means systems can choose the best.

7) Head Start Doesn't Work

A recent Opinion article in the Villages retirement paper picked up an editorial featuring the reported 2010 Head Start Impact Study that stated thee and four year olds participants in Head Start were no better prepared for first grade than non-participants. This is the nth such article/report I've read in thirty years. There have been many studies and none have shown Head Start improves academic performance. The normal curve rules and those who think it can be changes will have to wait for generic engineering. But the normal curve applies to other important characteristics and it is these our education system must foster.

Popular but Incorrect Neuromyths' from online.wsj.com/
    We use only 10% of our brains.
    A high stimulus environment improves the brain of preschool children.
    Using a student's preferred learning style improves learning.
The Thousands of Californians Who Failed The Bar Exam Are Going To Hate This Guy
is an example of how college can teach them but can't learn them. I wonder if college law schools are required to publish Bar Exams pass rates

Data from Iceland indicates that younger students in a class do poorer in standardized test through seven grades and other studies have shown that 10% of younger HS graduates go to college. The Economist, 12/7/12, p21

Watch Videos and Understand
Formula for changing math education
Ken Robinson Says Schools Kill Creativity
Elizabeth Gilbert On Genius

E-mail or antonw@ix.netcom.com the retired teacher/editor/authorWalter
 

edited and written by Walter Antoniotti
copyright 21st Century Learning Products   
All Rights Reserved 

Sundry Items of Interest

1) Non-academics students possess Characteristics of success
2) School Reform Stay Focused a book review of
How Children Succeed: Grit, Curiosity, and the Hidden Power of Character by Paul Tough from The Economist Magazine 1/19/13

3) Head Start leads to nonacademic value that will lead to economic and social success.

4) The Wage Affect of Offshoring examines data from Denmark to look at the connection between globalization, inequality and the value of a college degree. “With stagnating wages and lingering unemployment, income inequality is back in the headlines. Is globalization to blame for this inequality? Is more education a solution? This column argues that focusing on university education misses important effects. It presents evidence that wage effects vary markedly among those with degrees depending on their specific skill sets, and that globalization can often benefit workers without degrees.
For an economic analysis see Pure Competition Edited 1/30/13

5) Tradable goods are producing high paying jobs that require more education Germany does best at manufacturing tradable goods. She is avoiding high unemployment with job sharing, called discussed unemployment. I'm betting the recovery will bring back higher wages but hours work will stayed reduced as robots and computers do the work

Return to Class of Educating 2030

Please                                                                                 


Interesting Stories

The Story of Joan

An attempt to learn about the real estate business brought me in contact with Joan, middle aged women who had been a million dollar salesperson in her first year. She was well dressed, attractive, very ambition and had a talent for selling. Joan was famous for her answer to a question from prospective buyers who were aghast when they saw a foot of water in the basement of a home they might buy. “Well, think how lucky you are to know about the water. Now you can bid $3,000 lower and fix the problem for $1,000. Joan was correct; they bought and were very happy with the property. This was the middle 1970's when new starter homes were small, about 10,000 square feet, had one bathroom, three bedrooms, and cost about $40,000.

Joan wanted to be a real estate broker, but fail the test because of her poor mathematical skills. Math required for the license was using formulas, a little geometry, and multi-step word problems. Some of this was necessary for commercial developers but for what Joan wanted to do, little math was needed. But testing is a way to limit supply of brokers thus keeping commissions high.  Much of what I did was build her confidence that if she did the easy questions, a missed the few difficult questions, she would still pass. Needless to say, she passed the exam and years later, was still queen of the hill.

Joan was one of the most confident people I've encountered in many years of education. She went to school before testing sapped the vitality out of people who were not above average in both mathematic analysis and verbal understanding.  Interpersonal intelligence, easily the most important in the real world kind of intelligence, isn't considered important by our academic educators. 

The Rest of the Story

Joan had a secret to her success. She belonged to the Friday 7:00 AM Howard Johnson Breakfast Club. Two or three plus salespeople from ten or so local real estate companies met, talked a little business, and created a network. If you needed something for sale at one of your competitors, you called your friend from Friday mornings. They would call you. The more people you helped, the more people who would help you.

I once had the world's greatest house listing, A+ condition, location, and price. Two or three sales were stopped by parents coming to visit.  I had guaranteed the owner who was leaving for Venezuela it would be sold and he was nervous, but not me. With two weeks to go I called Joan and agreed to split the listing commission and it was sold the next day. Some people think Joan should go to college, I think school should be designed to maximize her special intelligence. edited 1/21/13

e-mail comments to antonw@ix.netcom.com


Battlefield Reflections of a
Life-Long Statistic Teacher

The Normal Curve Rules

Teaching Statistics to Open Enrollment
Evening College Students by
 Walter

Introduction: After years of traditional teaching I switched to Quick Notes Statistics a programmed type text and its companion Excel Statistics Lab Manual. With all the problems and their data sets written in Excel, much of the calculation requirements were removed as an obstacle to learning. Many students were familiar with the text as they had used Quick Notes Financial Accounting and/or  Economics Interactive Class Notes with Links in previous courses. These books were concise two-page outlines per chapter with practice problems and complete solutions.

Methodology: Class one began with a 30 minute summary of material covered on the first computerized take-home or in the lab test. We then adjourned to the lab with some of the better students leaving to do the work at their own convenience while the  others joined me in the lab learn to use Excel to  calculate measures of central tendency. Lectures/lab sessions followed. The class before the computerized test using Excel was a comprehensive hour or so review where I again saw the better students and after the review a few were off to the lab to finish their computerized  lab set due before the test. This procedure was followed for tests on probability and on hypothesis testing/correlation/regression.

Result: 1) Being an honor system take-home on a computer exam resulted in the same grade distribution as for traditional in class with a large note card exams. 2) More material was easily covered with less work and anxiety.  3) But only the better students learned more, much more. Students, as they had for over 35 years at four different average at best colleges, divided themselves into four groups.

Group one never really learned to use Excel to do much of anything and passed with low grades because of easy grading procedures.

Group two calculated some  statistics correctly but ran into trouble deciding which Excel menu procedure  to use for each of the eight different problems on the take home final. I had warned them that grades would go down with each tests, many would be disappointed. Some of these adults worked really hard but having to choose between finite and normal distributions, large and small samples, then between one sample and two samples eventually led to mistakes.

Group three often got the statistic correct but then had difficulty determining to accept or reject the no change null hypothesis.  All the studying in the world doesn't help because they had never really figured out what hypothesis testing was all about.

Group four had one final hurdle, explaining what the answer meant. They had correctly accepted or rejected the null hypothesis but what did it mean? They needed to write in the analysis section that the new procedure was faster or had less defects or the new diet was better or else it was back to group three and a lower grade. Less than six from a class of twenty-five got almost everything correct and got a 4 grade on almost every problem. A very few got everything correct.

copyright 21st Century Learning Products   
All Rights Reserved 

edited and written by Walter Antoniotti


Other Stuff

Popular but Incorrect Neuromyths' from online.wsj.com/
    We use only 10% of our brains.
    A high stimulus environment improves the brain of preschool children.
    Using a student's preferred learning style improves learning.
The Thousands of Californians Who Failed The Bar Exam Are Going To Hate This Guy
is an example of how college can teach them but can't learn them. I wonder if college law schools are required to publish Bar Exams pass rates

Data from Iceland indicates that younger students in a class do poorer in standardized test through seven grades and other studies have shown that 10% of younger HS graduates go to college. The Economist, 12/7/12, p21

Watch Videos and Understand
Formula for changing math education
Ken Robinson Says Schools Kill Creativity
Elizabeth Gilbert On Genius

Need Material for this space

e-mail   antonw@ix.netcom.com


Epilogue: The Cost of a Misdirected Education

My Keene State College 1990 Economics 101 class was given data showing that average college graduates make much more than high school graduates. They had seen it before. That is why most of them were in college. Then I showed them median income of college graduates. They were disappointed with the lower number. I explained how some really high earners make the mean higher than the median. Then I showed them data indicating the bottom quarter of college graduates earned about the same income as high school's top-quarter. They became more unsettled. Then I gave them the lowest income statistic of all,  median income for those with just a bachelor's degree. Those with higher degrees were left off. From the back of the room I heard  "you mean they are ripping us off.  

It took about twenty years, but I pleased to report that, because of the Great Recession,  mass media coverage of the decreasing economic return from a college education is no longer sporadic . But like any unwelcome news, parents, teachers, and politicians will be the last to react properly. The collateral damage has been immense. It will continue to be so unless some responsible mass media helps makes an educational system that improves the well-being of all students . Here is the collateral damage of our love affair with college.

College graduates who can't find a job and dropouts owe over one trillion dollars in outstand college loans and are finding they do not have the skills to earn a positive economic return from their investment.

Disgruntle U.S. graduates and dropouts whose needs were not met by their investment of many years in school and from whom society receive little support. In fact, many need society's support.

But some took the path less traveled. 

My fourteen year-old nephews announced he wanted to attend a neighboring carpentry high school. Four years of getting up early and getting a ride from his father to grandmother's house where he waited for the school bus to take him to a new, strange school. At fourteen! After school he walked the three miles home from grandma's house. No one told him from anyone, he just didn't like academics and decided on a vocational education. Now a successful small contractor, his biggest problem is convincing his wife they don't need a new Volvo every two years.

His younger brother was much more academic, but found school a waste of his lazy, but conniving mind. He dropped out early in the 9th grade, eventually went in the military, kept looking for a good job in corrections until he found a unionized one working for the state. No one had to tell him that investing in a 40K in addition to the state retirement plan was a good idea. He also bought car mortgage insurance a year before not being able to pay said liability.  

Epitaph: Many of our best and brightest did make a proper investment in college and there are enough of them to maintain our nation's well-being. Imagine a country where the school system maximizes all kinds of all Special Intelligence rather than maximizing the math/verbal intelligence of everyone including those with whose learning disabilities requires special attention. Edited 1/30/13

Older Generations Accumulate, Younger Generations Stagnate
CHANGE IN AVERAGE NET WORTH BY AGE GROUP, 1983–2010
from http://www.businessinsider


More Interesting Thoughts

Quotes

" The mind is not a vessel to be filled , but a fire to be kindled."  Plutarch The Week Magazine 11/02/12 p199

Edited 1/30/13

Obama Wants to Move U.S. Up

Early Years  Education The Economist Magazine 2/9/13
 

"Finland on top (it scored direly in the OECD study). At least 98% of children aged five or six are in pre-school education there. Finland also dominates the overall league tables for education performance, so perhaps the scope for improvement is slight. Other enthusiastic providers of pre-school education like Sweden, Norway, France and Belgium and Denmark do not score particularly highly on attainment in later education, whereas Japan, which combines early-years provision with a fiercely competitive exam culture, excels. So too does South Korea, where the state until now has provided under half of pre-school places. So pre-school is no panacea, says Andreas Schleicher, who oversees the OECD’s big triennial PISA report on educational attainment. “Drilling children” in early years does not lead automatically to learning gains, he says."


Editor's Note: I'd trade two more years of early childhood education for two less years of high school in a second. Academic kids not mature enough to leave home for college could go to junior college or work for a while, maybe as workers in a vast public/private pre-school industry.


GDP and Personal State Tax Burden Per Capita by State
Retirement Home Location Guide Provided Tax Data
Richest/Poorest State
GDP/Capita
territory per per territory per per territory per per territory per per territory per per Rank State GDP/ Taxes %
Taken
capita capita capita capita   capita capita   capita capita   capita capita  
 United States $47,482                          

50

Del

$69,667 3,426

8.4

 D C 174,500 1
 Colorado
51,940
11  Louisiana 47,467 21  North Carolina 42,884 31  Tennessee 39,730 41 1 Miss $28,,259 2,924 10.2
 Delaware 69,667 2 Calf 51,914 12  New Hampshire 47,385 22  Oklahoma 42,237 32  Michigan 37,616 42 2 Ark 29,999 3,088 10.3
 Alaska 65,143 3 Maryland 51,724 13  Nevada 47,222 23  Ohio 42,035 33  Kentucky 37,535 43 3 NM 30,642

3,031

09.9
 Connecticut 64,833 4 Minn 50,396 14  Texas 45,940 24  Utah 41,750 34  Montana 37,200 44 4 Utah 30,917 3,261 10.5
 Wyoming 63,667 5 ILL 50,328 15  Pennsylvania 45,323 25  Georgia 41,711 35  Arkansas 36,483 45 5 Idaho 31,031 3,139 10.2
 Massachusetts 58,108 6 SD 49,875 16  Rhode Island 45,000 26  Indiana 41,169 36  Alabama 36,333 46 States of Interest
 New York 57,423 7 Neb 49,778 17  Oregon 44,447 27  Missouri 41,117 37  New Mexico 35,952 47   Mass 49,203 5,047

10.3

 New Jersey 56,477 8 Hawaii 49,214 18  Kansas 44,310 28  Maine 40,923 38  South Carolina 35,717 48   Ohio 36,054 4,332

12.0

 Virginia 53,463 9 Iowa 49,067 19  Wisconsin 44,105 29  Arizona 40,828 39  West Virginia 35,053 49   NH 42,707 3,136

07.3

 Washington 52,403 10 ND 47,714 20  Vermont 44,000 30  Florida 40,106 40  Idaho 34,250 50   Fl 36,734 3,566

09.7

   State Tax Burden as a percentage of Income


Tax Burden Rank

Tax Burden 
as a Percentage 
of Income

Tax 
Burden
Per Capita

Income
Per Capita

United States

-

10.6%

$4,072

 $38,376

Alabama
Alaska
Arizona
Arkansas
California

46
50
32
27
15

8.8%
6.6%
10.1%
10.3%
10.9%

$2,881
2,598
3,350
3,088
4,451

$32,599
39,499
33,156
29,999
41,022

Colorado
Connecticut
Delaware
Florida
Georgia

38
9
48
39
  25

9.8%
11.3%
8.4%
9.7%
10.4%

$4,098
6,018
3,426
3,566
3,564

$41,987
53,152
40,964
36,734
34,327

Hawaii
Idaho
Illinois
Indiana
Iowa

5
31
14
12
26

11.7%
10.2%
10.9%
11.0%
10.4%

$4,496
3,159
4,335
3,796
3,709

$38,269
31,031
39,902
34,647
35,807

Kansas
Kentucky
Louisiana
Maine
Maryland

18
20
11
1
19

10.7%
10.7%
11.0%
13.5%
10.7%

$3,885
3,383
3,463
4,719
4,996

$36,209
31,639
31,358
34,935
46,562

Massachusetts
Michigan
Minnesota
Mississippi
Missouri

28
16
4
29
34

10.3%
10.8%
11.9%
10.2%
9.9%

$5,047
3,965
4,930
2,924
3,509

$49,203
36,751
41,363
28,591
35,408

Montana
Nebraska
Nevada
New Hampshire
New Jersey

42
6
43
49
17

9.5%
11.6%
9.5%
7.3%
10.8%

$3,108
4,294
3,758
3,136
5,234

$32,719
36,999
39,683
42,707
48,590

New Mexico
New York
North Carolina
North Dakota
Ohio

36
2
23
37
3

9.9%
12.9%
10.5%
9.8%
12.0%

$3,031
5,734
3,526
3,421
4,332

$30,642
44,571
33,732
34,808
36,054

Oklahoma
Oregon
Pennsylvania
Rhode Island
South Carolina

40
35
24
8
30

9.6%
9.9%
10.4%
11.5%
10.2%

$3,129
3,492
4,057
4,629
3,213

$32,661
35,300
38,849
40,331
31,480

South Dakota
Tennessee
Texas
Utah
Vermont

45
47
44
22
10

9.2%
8.6%
9.4%
10.5%
11.1%

$3,177
2,979
3,368
3,261
4,118

$34,647
34,568
35,913
30,917
37,025

Virginia
Washington
West Virginia
Wisconsin
Wyoming

41
13
21
7
33

9.5%
10.9%
10.6%
11.6%
10.1%

  $4,056
4,334
3,212
4,289
4,120

$42,642
39,705
30,317
37,115
40,917

District of Columbia

-

12.8%

$8,092

$63,044


Massachusetts Test Well  

See also Careers Needing Workers and Determining the Economic Return of a College Education  e-mail comments to antonw@ix.netcom.com  

15 most valuable majors
in the current marketplace.
Annual pay for bachelor’s graduates without higher degrees. Typical starting graduates have two years of experience; mid-career graduates have 15 years. see top 130 at payscale.com
 

#3 The 10 Worst Majors
"
Not all college degrees are created equal. ...Georgetown University, your choice of college major substantially affects your employment prospects and earnings."  forbes.com/sites/jennagoudreau 10/11/12

#4 13 surprisingly-low-paying-jobs/

2/28/13 Jacquilin Smith


1. Major Salary after 10 years Major Salary
Grads/
Exper
Unemployed
Grads. 22-26
Exper. 30-54
Career Mean Salary
Bottom 10%
Number
Employed
1. Petro Engin $98,000     $163,000 1. Anthropology
    Archeology
$28,000
$52,000
10.5%
6.2%
1. Private Detective $48,610
$26,080
26,080
2. Aerospace Engin $62,500      $118,000 2.Film,Video,
   Photographic Arts
$30,000
$50,000
12.9%
6.7%
2. Surgical Technician $42,460
$28,860
94,490
3. Actuarial Math $56,000       $112,000 3.Fine Arts $30,000
$45,000
12.6%
7.3%
3. Flight Attendants $41,720
$24,990
87,190
4. Chem Engin $67,500      $111,000 4.Philosophy/Relegion $30,000
$48,000
10.8
6.8%
4. Desktop Publishers $39,030
$21,320
18,620
5. Nuclear Engin $66,800      $107,000 5. Liberal Arts $30,000
$50,000
9,2%
6.2%
5.Marriage/Family
   Therapist
$48,710
$25,230
33,990
6. Elect Engin $63,400       $106,000 6.Music $30,000
$45,000
9.2%
4.5%
6. Fire Fighters $47,720
$22,480
304,080
7. Comp Engin $62,700       $105,000 7.Physical Fitness
   Parks & Recreation
$30,000
$50,000
8.3%
4.5%
7.Radio/TV Announcers $40,510
$17,150
31,680
8. Applied Mathematics $50,800       $102,000 8.Commercial and
   Graphic Arts
$32,000
$49,000
11.8%
7.5%
8. Embalmers $$45,060
$27,010
6360
9. Comp Science $58,400       $100,000 9. History $32,000
$54,000
5.8%
5.4%
9. Reporters
    Correspondents
$43,640
$20,000
45,270
10. Statistics $49,300       $99,500 10. Eng. Lang./Literature $32,000
$52,000
9.2%
6.2%
10. Tax Preparers $39,410
$18,440
59,180
11. Physics $51,200       $99,100   11. Legisytlators $$38,860
$16,280
62,180
12. Mech Engin $60,100       $98,400 12. Models $27,830
$15,960
2,760
13.Biomed Engin $54,900       $98,200 13.Chefs/Head Cooks $46,600
$24,770
90,300
14. Government $42,000       $95,600

The Sole Purpose of Education
By Barry Ritholtz - November 12th, 2010, 2:00PM

In 1914, John Alexander Smith, Professor of Moral Philosophy at Oxford, addressed the first session of his two-year lecture course as follows:

“Gentlemen, you are now about to embark on a course of studies that (will) form a noble adventure…Let me make this clear to you. ..nothing that you will learn in the course of your studies will be of the slightest possible use to you in after life – save only this – that if you work hard and intelligently, you should be able to detect when a man is talking rot, and that, in my view, is the main, if not the sole purpose of education.”

That quote reminds me of the famous Joan Robinson line: “The purpose of studying economics is not to acquire a set of ready-made answers to economic questions, but to learn how to avoid being deceived by economists.”


15. Economics $48,500       $44,900

The Truth Behind High College Grades


From less than 40% to about 85% A's and Bs   NYT 7/14/11
People who work for colleges are increasing their own economic wellbeing by using high grades to make demand inelastic and milk the public. Were college catalogs changed to say average is
B+ to A-.

In These Selected Countries Income Was Less Equally Distributed, Some Northern European Countries and Canada Increase $ to the Poor, The US and GB did not!

Gini coefficient, before taxes and transfers[12]
Country mid-70s mid-80s around 1990 mid-90s around 2000 mid-2000s Late 2000s
South Korea has the most equally distribution of income 0.344
Norway   0.351   0.404 0.426 0.447 0.410
Denmark   0.373 0.396 0.417 0.415 0.417 0.416
Canada 0.385 0.395 0.403 0.430 0.440 0.436 0.441
United Kingdom 0.338 0.419 0.439 0.453 0.458 0.445 0.456
Finland 0.343 0.387   0.479 0.478 0.483 0.465
United States 0.406 0.436 0.450 0.477 0.476 0.486 0.486
Germany   0.439 0.429 0.459 0.471 0.499 0.504
Germany's income distribution equality is still affected by reunification
Gini coefficient, after taxes and transfers[12]
Country mid-70s mid-80s around 1990 mid-90s around 2000 mid-2000s Late 2000s
 Denmark   0.221 0.226 0.215 0.226 0.232 0.248
 Norway   0.222   0.243 0.261 0.276 0.250
 Finland 0.235 0.209   0.218 0.247 0.254 0.259
 Germany   0.251 0.256 0.266 0.264 0.285 0.295
 S Korea           0.306 0.315
 Canada 0.304 0.293 0.287 0.289 0.318 0.317 0.324
 U Kingdom 0.268 0.309 0.354 0.336 0.351 0.331 0.345
 U States 0.316 0.337 0.348 0.361 0.357 0.380 0.378
Both England and the US have given more to the rich! Has it affected Education?


Table 1.4: Occupations with the most job growth, 2010 and projected 2020
(Numbers in thousands)
from http://www.bls.gov/emp/ep_table_104.htm

2010 National Employment Matrix title and code

Employment

Change, 2010-20

Median annual wage, 2010

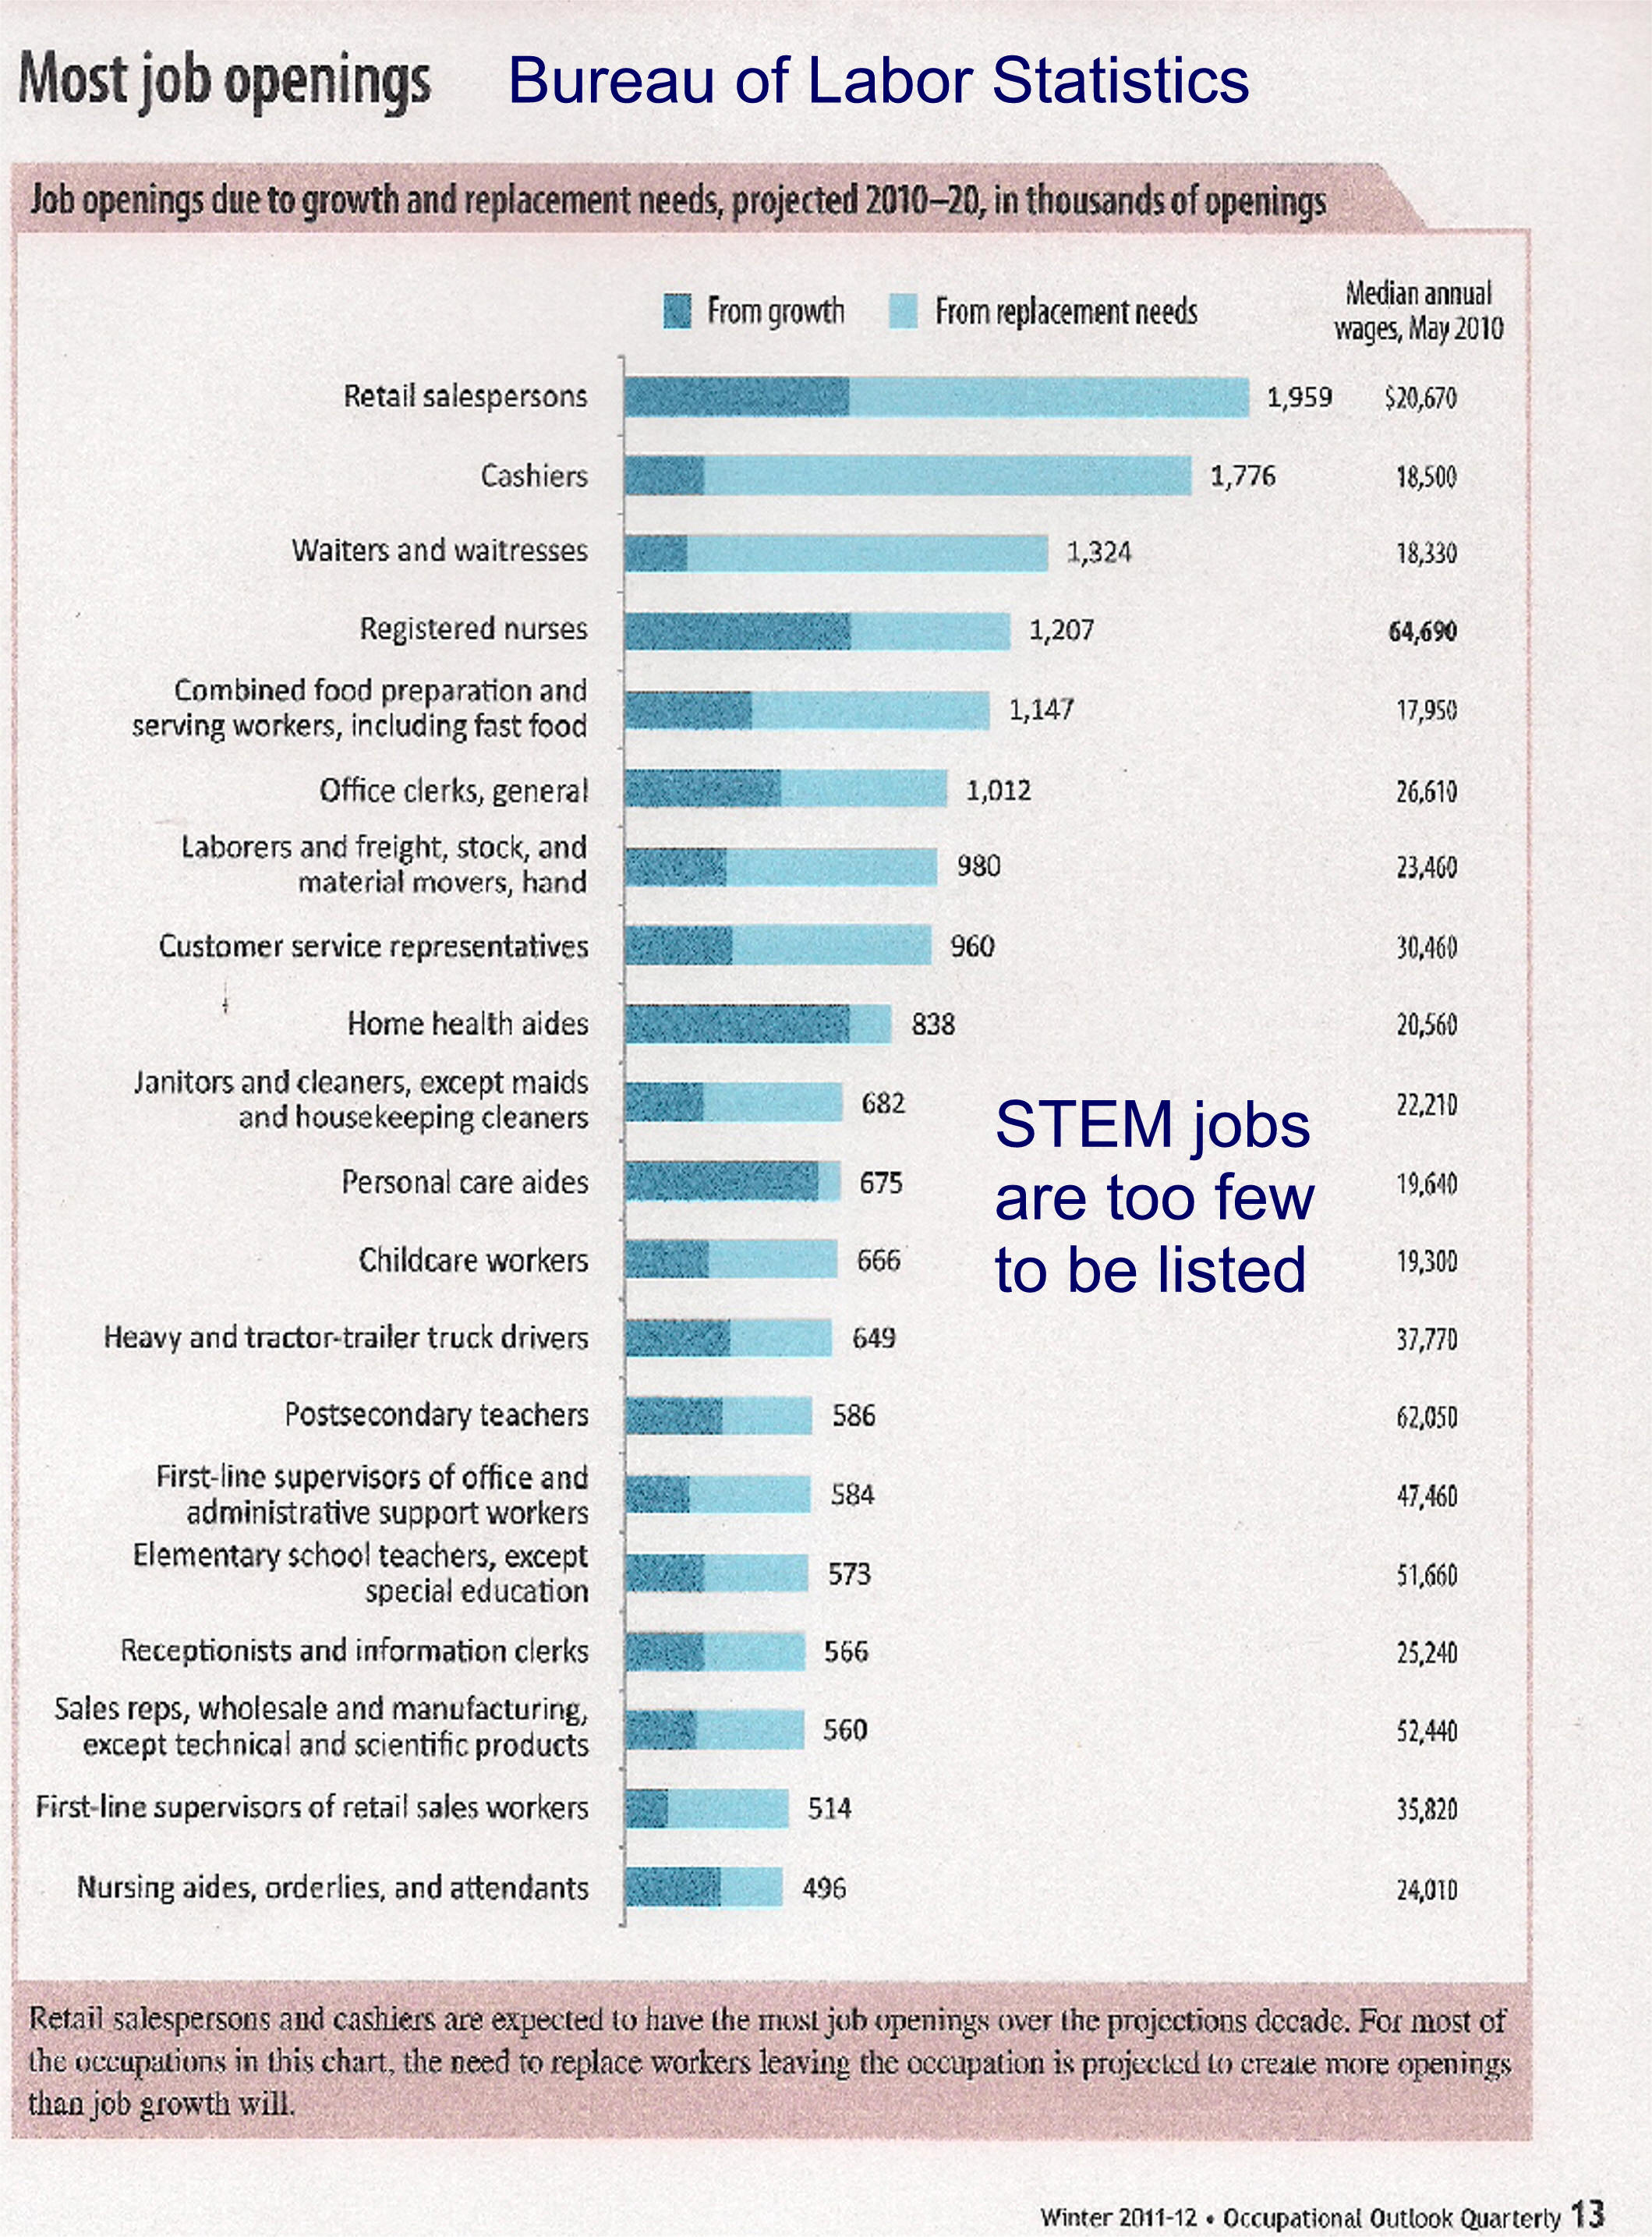
These top  30 positions represent about  9,286,000 of the20,469,000 positions to be created.


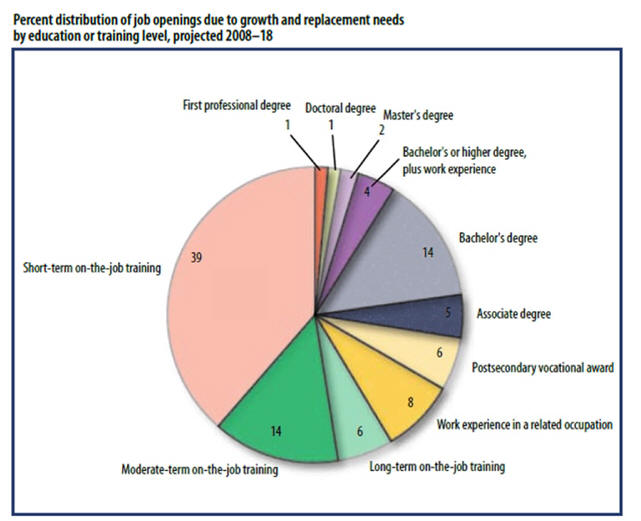
Only ten positions consisting of 3.005,000 positions to be created are in positions that paid over the median 2010  salary of $33,840.


Entering nursing on a registered nursing career path requires an AA or BS Degree.


Only 746,000 positions(3.6%) require a  bachelors degree only to work as a primary/ secondary teachers or accountants/auditors.

Only 0.0079 will be doctors.

2010

2020

Number

Percent

Rank-

Total, All Occupations

143,068

163,537

20,469

14

$33,840

1

Registered Nurses

2,737

3,449

712

26

64,690


Retail Salespersons

4,262

4,968

707

17

20,670


Home Health Aides

1,018

1,724

706

69

20,560


Personal Care Aides

861

1,468

607

70

19,640


Office Clerks, General

2,951

3,440

490

17

26,610


Combined Food Preparation and Serving Workers, Including Fast Food

2,682

3,080

398

15

17,950


Customer Service Representatives

2,187

2,526

338

16

30,460


Heavy and Tractor-Trailer Truck Drivers

1,605

1,935

330

21

37,770


Laborers and Freight, Stock, and Material Movers, Hand

2,068

2,387

319

15

23,460

10

Postsecondary Teachers

1,756

2,062

306

17

45,690


Nursing Aides, Orderlies, and Attendants

1,505

1,808

302

20

24,010


Childcare Workers

1,282

1,544

262

20

19,300


Bookkeeping, Accounting, and Auditing Clerks

1,898

2,157

259

14

34,030


Cashiers

3,363

3,613

250

7

18,500


Elementary School Teachers, Except Special Education

1,476

1,725

249

17

51,660


Receptionists and Information Clerks

1,048

1,297

248

24

25,240


Janitors and Cleaners, Except Maids and Housekeeping Cleaners

2,310

2,557

246

11

22,210


Landscaping and Grounds keeping Workers

1,152

1,392

241

21

23,400


Sales Representatives, Wholesale and Manufacturing, Except Technical and Scientific Products

1,430

1,653

223

16

52,440

20

Construction Laborers

999

1,211

212

22

29,280


Medical Secretaries

509

719

210

41

30,530


First-Line Supervisors of Office and Administrative Support Workers

1,424

1,628

203

14

47,460


Carpenters

1,002

1,198

196

20

39,530


Waiters and Waitresses

2,260

2,456

196

9

18,330


Security Guards

1,036

1,231

195

19

23,920


Teacher Assistants

1,288

1,479

191

15

23,220


Accountants and Auditors

1,217

1,408

191

16

61,690


Licensed Practical and Licensed Vocational Nurses

752

921

168

22

40,380


Physicians and Surgeons

691

859

168

24

111,570

30

Medical Assistants

528

690

163

31

28,860

        9286    

Source: Employment Projections program, U.S. Department of Labor, U.S. Bureau of Labor Statistics

Back to top     hhhhhhhh


hh ddd